Marketing
All your marketing performance, creatives, audiences and insights in one place.
Data updated 7m ago●
Total Spend
₹12.4L
↑ 12.6% vs Apr 12 – May 11
Revenue
₹38.2L
↑ 18.7% vs Apr 12 – May 11
MER (Marketing Efficiency)
3.08
↑ 16.1%
ROAS
3.42
↑ 14.3%
CAC
₹472
↓ 8.7%
New Customers
742
↑ 11.9%
AI Marketing Brief
✦
Meta spend increased 12% but MER decreased 8%.
✦
Creative fatigue detected in 8 ads. Refresh recommended.
✦
Google Search campaigns driving highest LTV customers.
✦
Competitors launched 12 new creatives this week.
✦
UGC ads continue to deliver highest ROAS across channels.
Channel Performance
Creative Library 6,842 creatives
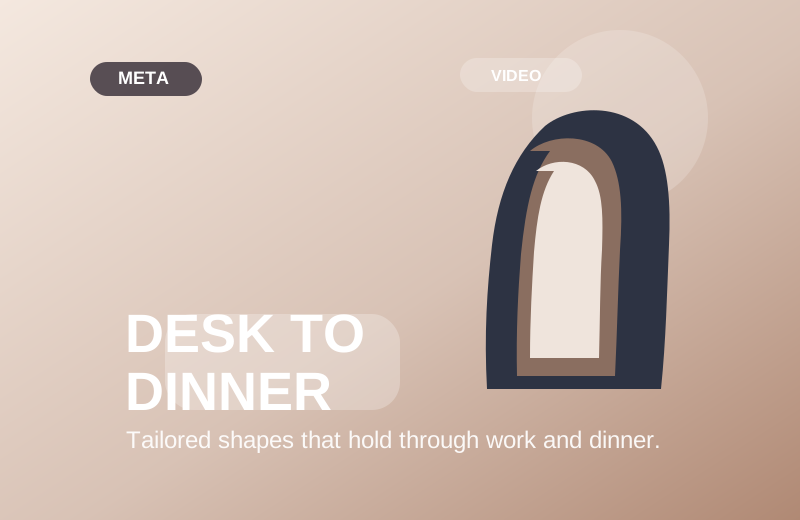
VIDEO
DESK TO
DINNER.
STYLED RIGHT.
0:23
Desk To Dinner, Styled Right
◎Meta
ROAS
5.21
CTR
2.61%
CPA
₹322
Spend
₹82K
Active27 days
★★★★★
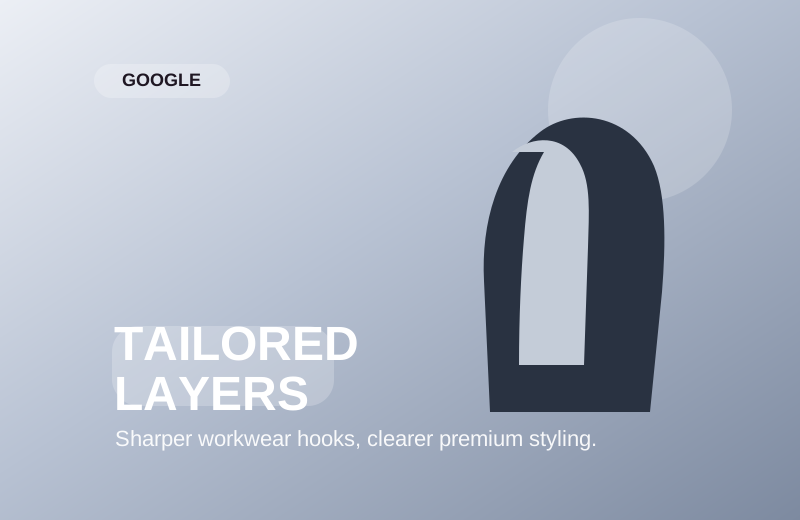
CAROUSEL
CAROUSEL
LAYER.
STYLE.
REPEAT.
0:23
Layer. Style. Repeat.
◎Meta
ROAS
4.32
CTR
2.11%
CPA
₹415
Spend
₹67K
Active18 days
★★★★★
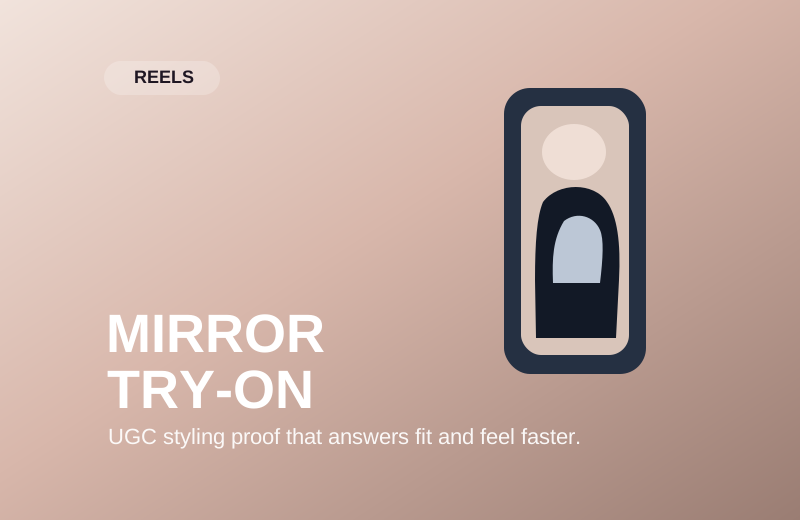
VIDEO
MIRROR
CHECK
APPROVED.
0:23
Mirror Check Approved
◎TikTok
ROAS
4.08
CTR
1.93%
CPA
₹356
Spend
₹54K
Active12 days
★★★★★
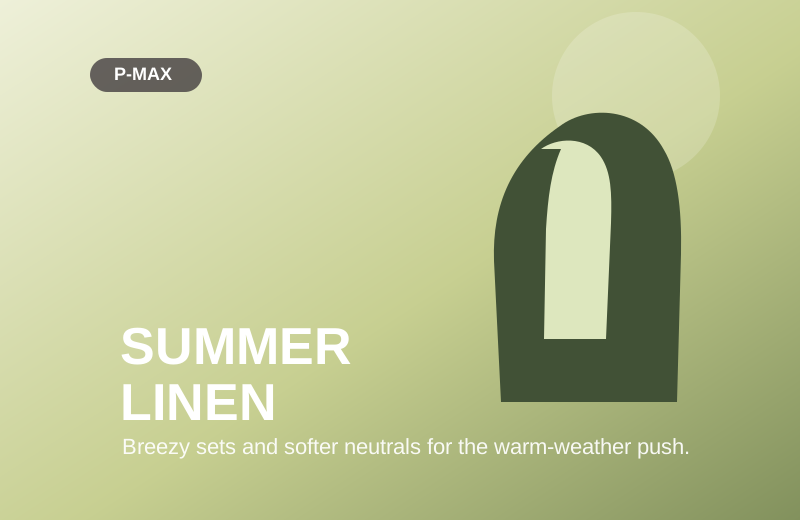
IMAGE
SUMMER
LINEN
EDIT
0:23
Summer Linen Edit
◎Google
ROAS
3.92
CTR
3.01%
CPA
₹289
Spend
₹38K
Active21 days
★★★★★
UGC VIDEO
LOOKS
BETTER
ON.
0:23
Looks Better On
◎Meta
ROAS
3.78
CTR
2.34%
CPA
₹378
Spend
₹45K
Active16 days
★★★★★
Performance Trends
Spend Revenue ROAS
May 12May 17May 22May 27Jun 1Jun 6Jun 10
Attribution Overview
View full report →₹38.2L
Total Revenue
Meta Ads
₹16.8L (44%)Google Ads
₹9.4L (25%)Direct
₹5.4L (14%)Email
₹3.2L (8%)Others
₹3.2L (9%)Top Performing Creatives
View all →Marketing Funnel (Last 30 days)
Impressions
↓ 5%
12.4M
Clicks
↑ 8%
312K
Add to Cart
↑ 11%
18,721
Purchases
↑ 13%
2,843
CVR 0.91%
AI Recommendations